Privacy-first telemetry for your DOCX editor
Version 2.29 adds @docx-editor.dev/telemetry. Measure how fast typing feels and how long documents take to open, with diagnostics that exclude document content.
Version 2.29 adds @docx-editor.dev/telemetry. It measures the editing
experience in your app: how fast a key press reaches the screen, how long a
document takes to open, and how layout time grows with document size. Built-in
diagnostics contain codes, buckets, and timings. They exclude document content.
Measure what people feel
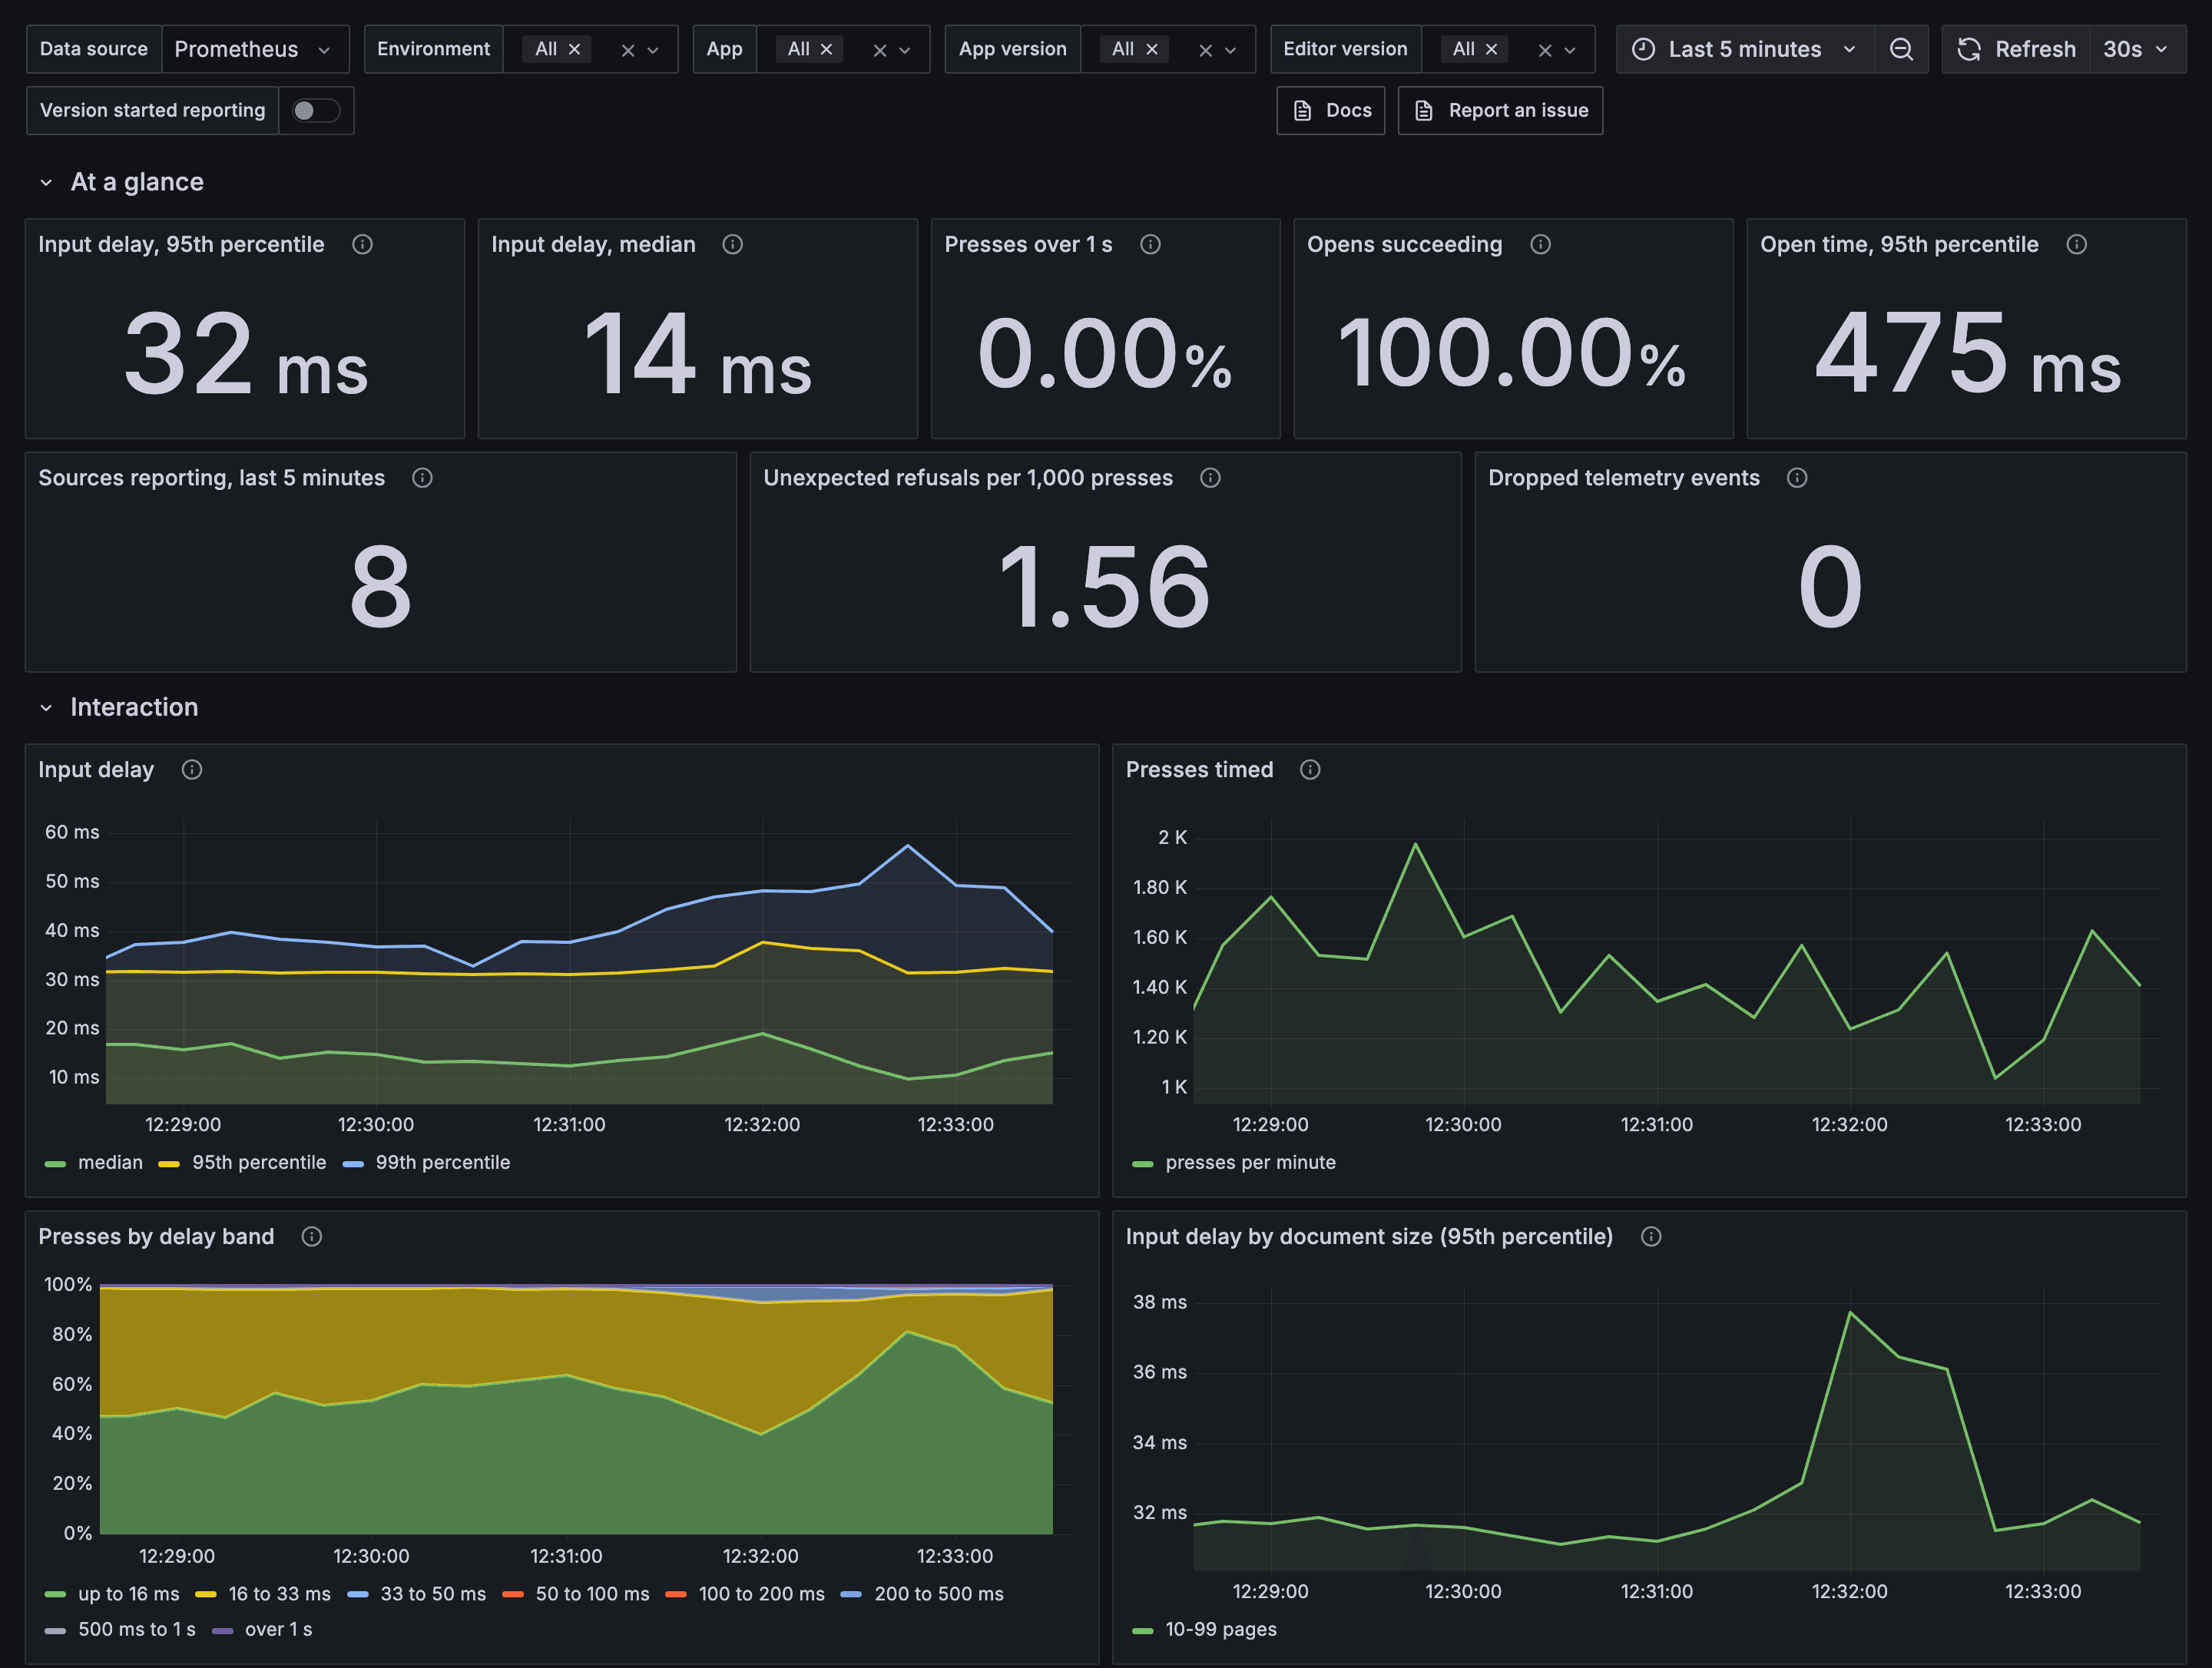
- Input delay. The time from a key press or click to the next frame on screen, as a median and a 95th percentile.
- Open time. The time from the start of an open to the first laid-out page, by file size.
- Layout time by document size. How the engine scales from a one-page letter to a long report.
- Editor and app versions. Compare an upgrade with the version before it.
The editor sends one performance summary per minute of use, so the volume stays low. For the measurements, see Measure performance.
Add it to your editor
Create one client outside your components. This example posts events to a route on your own origin and stops when the browser sends Global Privacy Control or Do Not Track:
// telemetry.ts
import {
  browserPrivacySignals,
  createTelemetry,
  httpExporter,
} from '@docx-editor.dev/telemetry';

export const telemetry = createTelemetry({
  exporters: [httpExporter({ url: '/api/telemetry' })],
  include: { documentOpen: true, editing: true, performance: true },
  consent: browserPrivacySignals({ optOutKey: 'my-app:telemetry' }),
});
Register the client's module in the editor:
import { DocxEditor } from '@docx-editor.dev/react';
import { telemetry } from './telemetry';

const MODULES = [telemetry.module];

export function Editor({ bytes }: { bytes: Uint8Array }) {
  return <DocxEditor document={bytes} modules={MODULES} />;
}
On the server, telemetryRoute from @docx-editor.dev/telemetry/ingest
validates each event and forwards it to your log service. The log service
token stays on the server. For the route, see
Send to a log service.
Privacy first
- The package sends nothing by itself. It sends events only to the exporters you configure.
- Your
consentfunction runs before each event. When it returnsfalse, the client drops the event. - Built-in diagnostics use closed lists of codes, booleans, bucketed sizes and counts, and timings. They exclude document text, file names, part names, author names, font names, and exception messages.
- The package validates the built-in fields again before export. You control the attributes and resource values you add, and the data your monitoring SDKs collect.
These selected fields describe one performance summary:
{
  "kind": "performance",
  "windowMs": 60000,
  "pagesBucket": "10-99",
  "interaction": { "count": 212, "p50Ms": 36, "p95Ms": 78, "maxMs": 140 },
  "editorSessionId": "e_8e8e909b-b44b-4223-8b25-fa61ef8da4f9"
}
Each editor generates a random session identifier and does not store it on the device. Your logs keep it, so an identifier you add can link it to a person. For every field and rule, see Privacy. To prepare a data protection review, use the Privacy review checklist.
Send it where your team looks
| Destination | Use it for |
|---|---|
| OpenTelemetry | Metrics in Grafana, Datadog, Honeycomb, or New Relic. |
| A log service | Event logs in Better Stack, Axiom, or Datadog Logs. |
| Sentry | Grouped issues, each with a code and a hint. |
| Your own code | PostHog, Datadog RUM, or your logger. |
When the editor refuses an action, such as typing in a read-only document, the event carries a stable code. Each code links to a hint in Diagnostics.
Dashboards
Two Grafana dashboards are ready to import. Editor experience shows input delay, open time, and layout time. Collaboration shows rooms, people, memory, and server work.
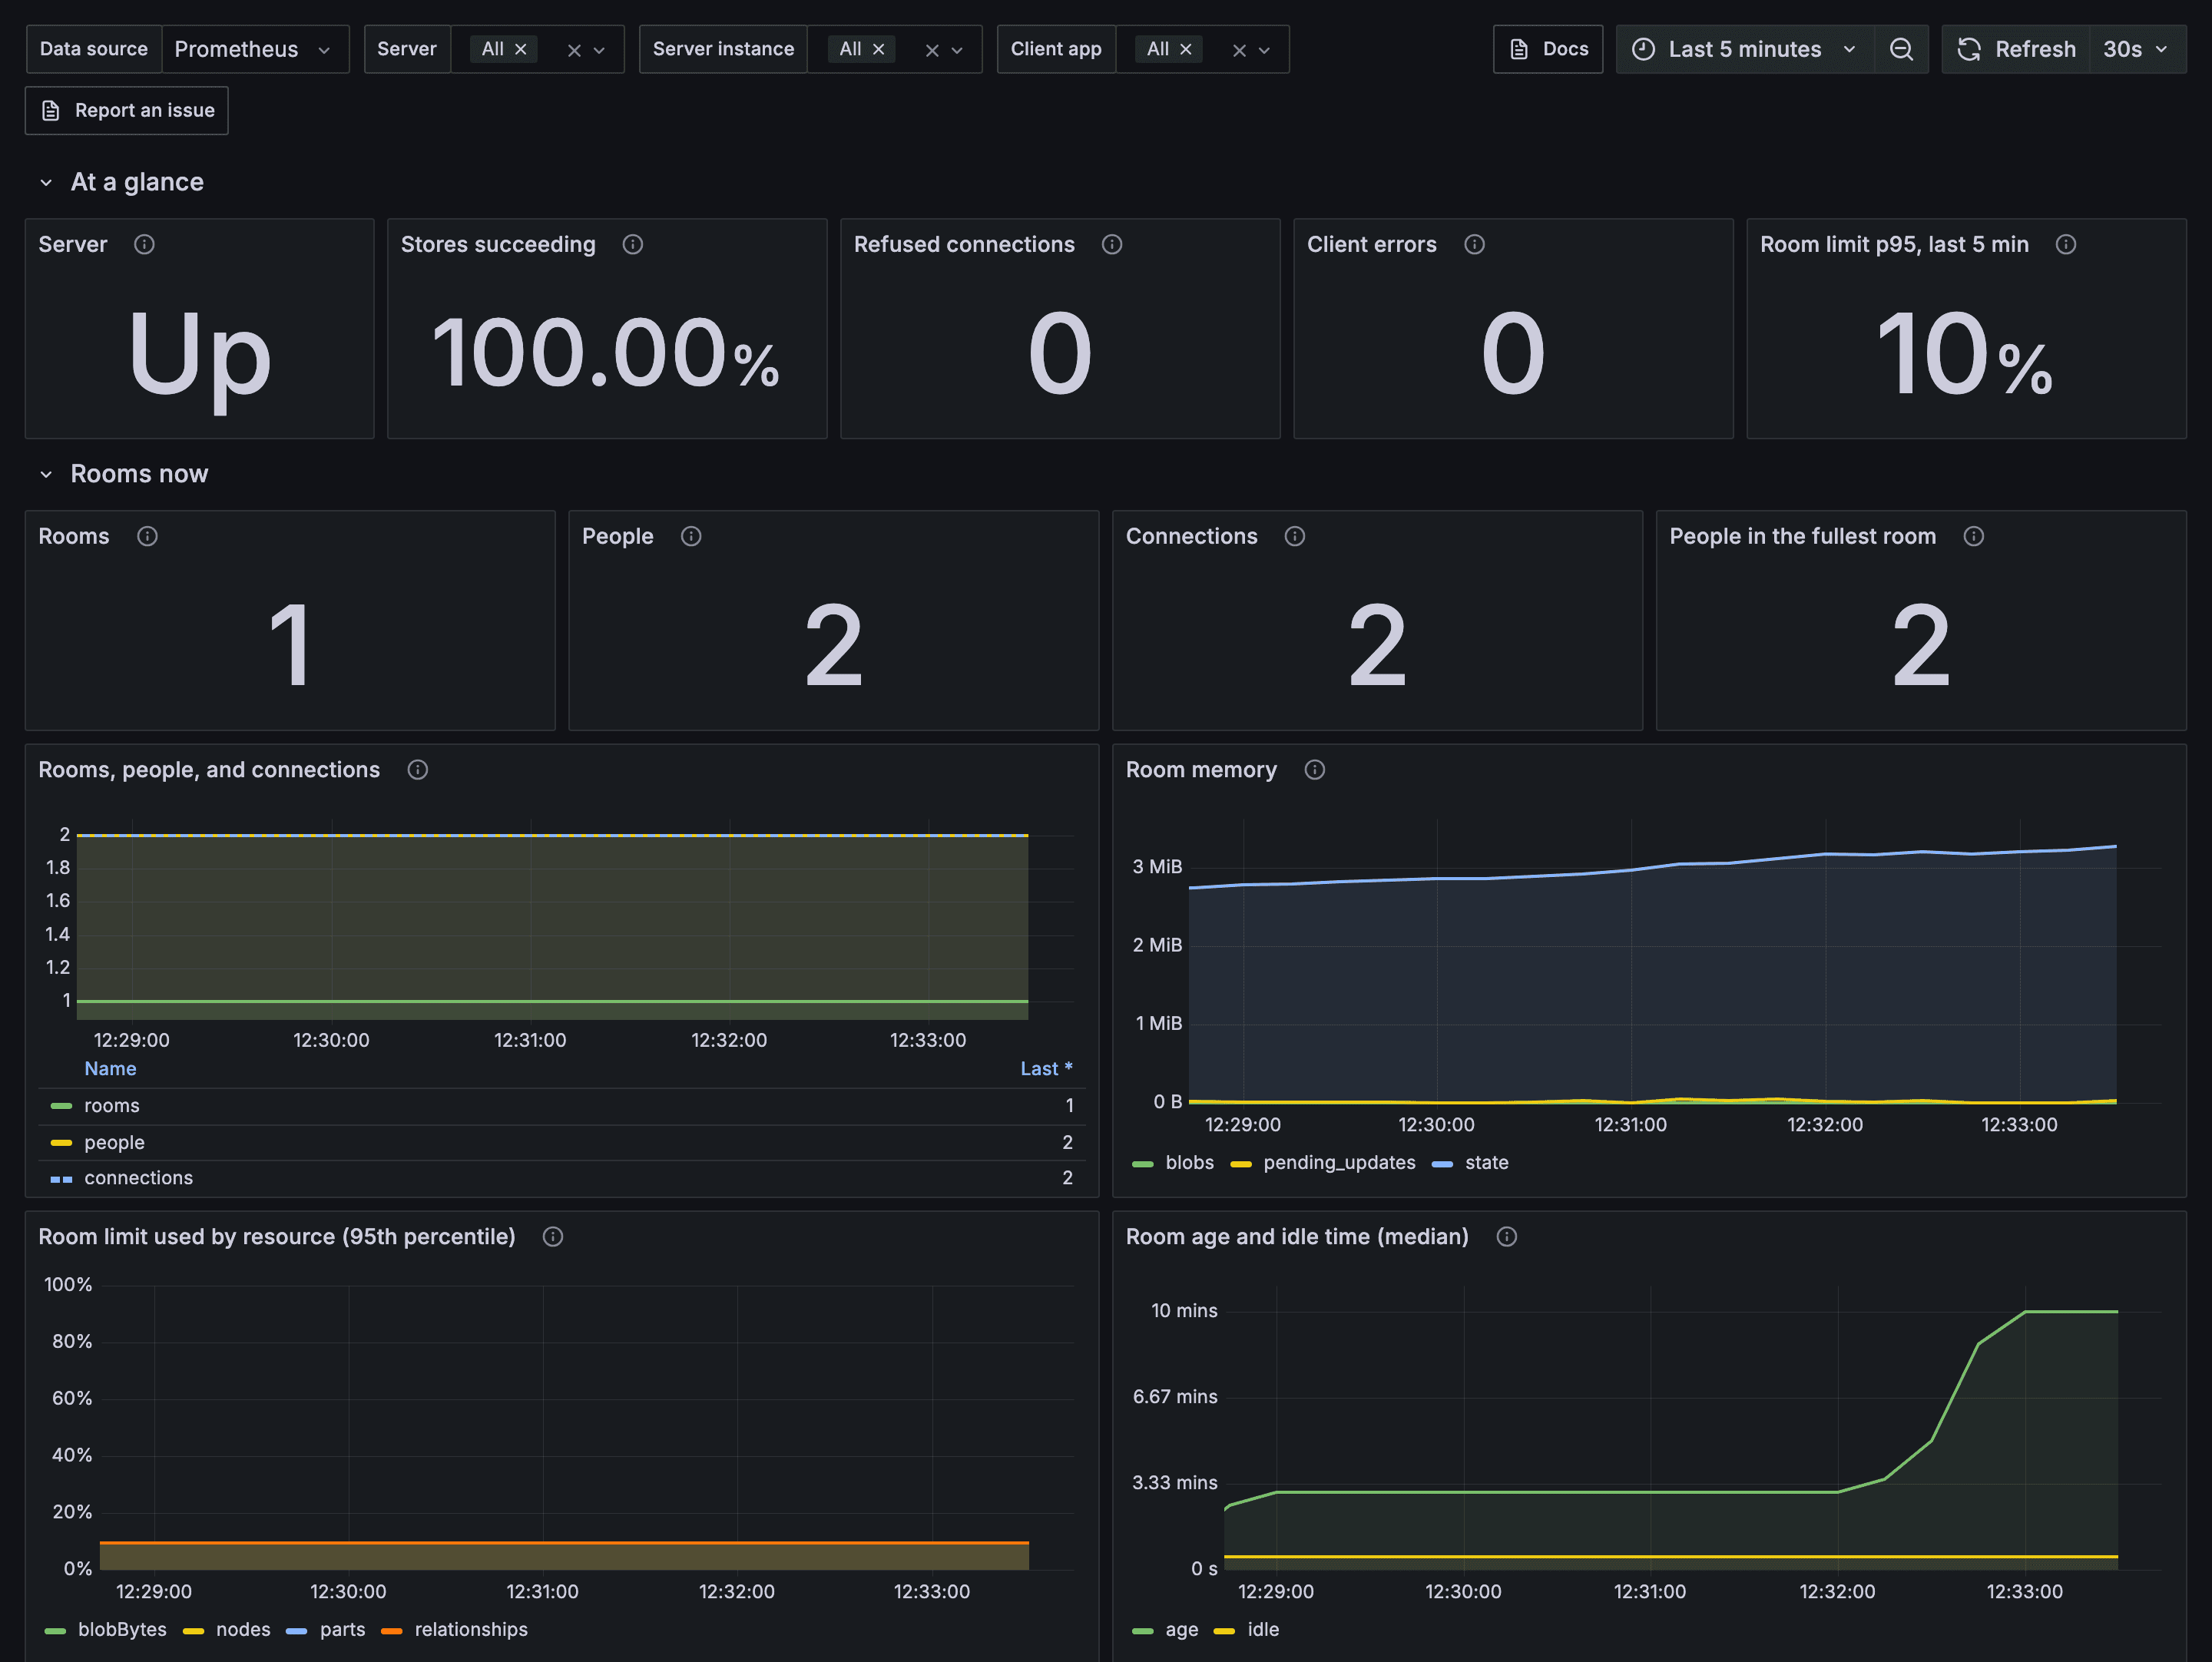
The dashboards set no targets. Use a few weeks of your own traffic to choose targets and alert thresholds. For download and import steps, see Dashboards.
Next steps
- Read the telemetry overview.
- Set up an editor.
- Explore editor telemetry.
@docx-editor.dev/telemetry uses the EigenPal Pro License. You can evaluate
it for free. For production use, see Pricing.